
Standard deviation is a statistical measurement of the amount a number varies from the average number in a series. A low standard deviation means that the data is very closely related to the average, thus very reliable. A high standard deviation means that there is a large variance between the data and the statistical average, and is not as reliable. Keep reading for standard deviation examples and the different ways it appears in daily life.
Calculating Standard Deviation
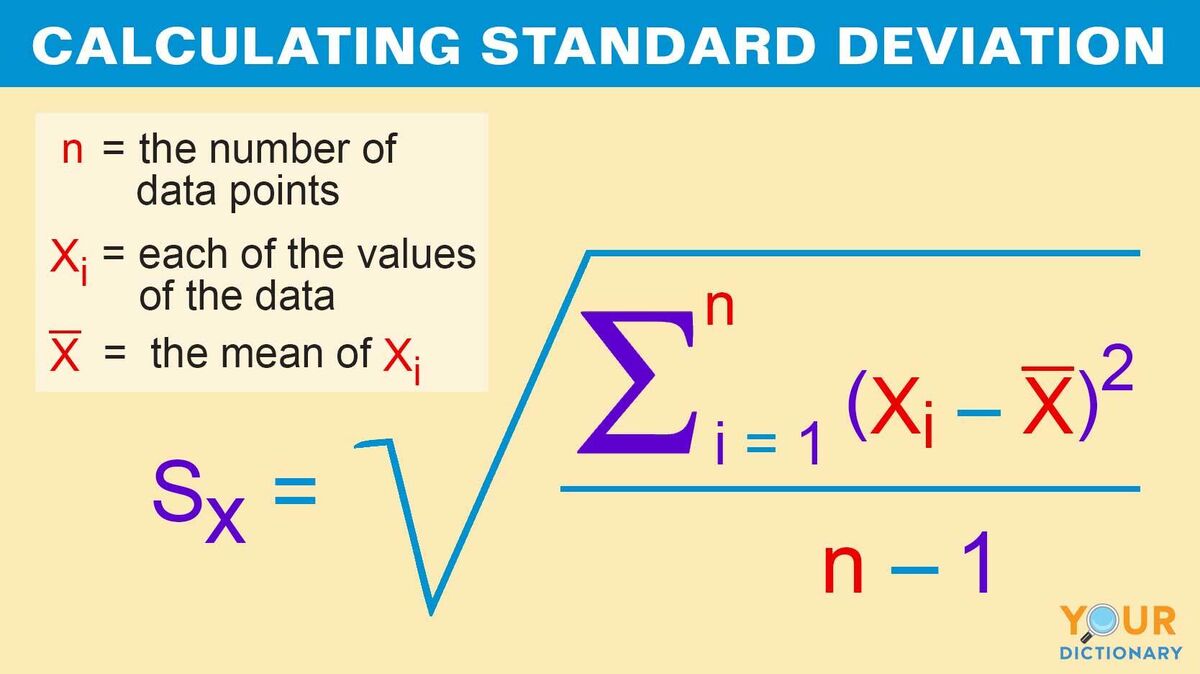
Standard deviation measures how far results spread from the average value. You can find the standard deviation by finding the square root of the variance, and then squaring the differences from the mean. If you’re wondering, “What is the formula for standard deviation?” it looks like this:
In order to determine standard deviation:
- Determine the mean (the average of all the numbers) by adding up all the data pieces (xi) and dividing by the number of pieces of data (n).
- Subtract the mean (x̄) from each value.
- Square each of those differences.
- Determine the average of the squared numbers calculated in #3 to find the variance. (In sample sizes, subtract 1 from the total number of values when finding the average.)
- Find the square root of the variance. That’s the standard deviation!
For example: Take the values 2, 1, 3, 2 and 4.
1. Determine the mean (average):
2 + 1 +3 + 2 + 4 = 12
12 ÷ 5 = 2.4 (mean)
2. Subtract the mean from each value:
2 - 2.4 = -0.4
1 - 2.4 = -1.4
3 - 2.4 = 0.6
2 - 2.4 = -0.4
4 - 2.4 = 1.6
3. Square each of those differences:
-0.4 x -0.4 = 0.16
-1.4 x -1.4 = 1.96
0.6 x 0.6 = 0.36
-0.4 x -0.4 = 0.16
1.6 x 1.6 = 2.56
4. Determine the average of those squared numbers to get the variance.
0.16 + 1.96 + 0.36 + 0.16 + 2.56 = 5.2
5.2 ÷ 5 = 1.04 (variance)
5. Find the square root of the variance.
Square root of 1.04 = 1.01
The standard deviation of the values 2, 1, 3, 2 and 4 is 1.01.
Examples of Standard Deviation
Unless you’re sitting in a statistics class, you may think that standard deviation doesn’t affect your everyday life. But you’d be wrong! Even though most statisticians calculate standard deviation with computer programs and spreadsheets, it’s helpful to know how to do it by hand.
Here are some examples of situations that demonstrate how standard deviation is used.
Grading Tests
A class of students took a math test. Their teacher wants to know whether most students are performing at the same level, or if there is a high standard deviation.
1. The scores for the test were 85, 86, 100, 76, 81, 93, 84, 99, 71, 69, 93, 85, 81, 87, and 89. When the teacher adds them together, she gets 1279. She divides by the number of scores (15) to get the mean score.
1279 ÷ 15 =85.2 (mean)
2. 85.2 is a high score, but is everyone performing at that level? To find out, the teacher subtracts the mean from every test score.
85 - 85.2 = -0.2
86 - 85.2 = 0.8
100 - 85.2 = 14.8
76 - 85.2 = -9.2
81 - 85.2 = -4.2
93 - 85.2 = 7.8
84 - 85.2 = -1.2
99 - 85.2 = 13.8
71 - 85.2 = -14.2
69 - 85.2 = -16.2
93 - 85.2 = 7.8
85 - 85.2 = -0.2
81 - 85.2 = -4.2
87 - 85.2 = 1.8
89 - 85.2 = 3.8
3. She squares each difference:
-0.2 x -0.2 = 0.04
0.8 x 0.8 = 0.64
14.8 14.8 = 219.04
-9.2 x -9.2 = 84.64
-4.2 x -4.2 = 17.64
7.8 x 7.8 = 60.84
-1.2 x -1.2 = 1.44
13.8 x 13.8 = 190.44
-14.2 x -14.2 = 201.64
-16.2 x -16.2 = 262.44
7.8 x 7.8 = 60.84
-0.2 x -0.2 = 0.04
-4.2 x -4.2 = 17.64
1.8 x 1.8 = 3.24
3.8 x 3.8 = 14.44
4. The teacher finds the variance, which is the average of the squares:
0.04 + 0.64 + 219.04 + 84.64 + 17.64 + 60.84 +1.44 +190.44 +201.64 +262.44 + 60.84 + 0.04 + 17.64 + 3.24 + 14.44 = 1135
830.64 ÷ 15 = 75.6 (variance)
5. Last, the teacher finds the square root of the variance:
Square root of 75.6 = 8.7 (standard deviation)
The standard deviation of these tests is 8.7 points out of 100. Since the variance is somewhat low, the teacher knows that most students are performing around the same level.
Results of a Survey
A market researcher is analyzing the results of a recent customer survey that ranks a product from 1 to 10. He wants to have some measure of the reliability of the answers received in the survey in order to predict how a larger group of people might answer the same questions.
Because this is a sample size, the researcher needs to subtract 1 from the total number of values in step 4.
- The scores for the survey are 9, 7, 10, 8, 9, 7, 8, and 9. The mean is 8.4.
- The researcher subtracts the mean from every score (differences: 0.6, -1.4, 1.6, -0.4, 0.6, -1.4, -0.4, 0.6).
- He squares each number (0.36, 1.96, 2.56, 0.16, 0.36, 1.96, 0.16, 0.36).
- Because this is a sample of responses, the researcher subtracts one from the number of values (8 values -1 = 7) to average squares and find the variance: 1.12 (variance)
- Last, the researcher finds the square root of the variance: 1.06 (standard deviation)
The standard deviation is 1.06, which is somewhat low. The researcher now knows that the results of the sample size are probably reliable.
Weather Forecasting
You can also use standard deviation to compare two sets of data. For example, a weather reporter is analyzing the high temperature forecasted for two different cities. A low standard deviation would show a reliable weather forecast.
- The reporter compares a week of high temperatures (in Fahrenheit) in two different seasons. The data looks like this:
City A Forecast | City B Forecast | |
Monday | 95 | 90 |
Tuesday | 93 | 81 |
Wednesday | 95 | 95 |
Thursday | 94 | 91 |
Friday | 96 | 86 |
Saturday | 94 | 82 |
Sunday | 95 | 78 |
The mean temperature for City A is 94.6 degrees, and the mean for City B is 86.1 degrees.
- The reporter subtracts City A’s mean from every City A temperature (differences: 0.4, -1.6, 0.4, -0.6, 1.4, -0.6, 0.4).
- He squares each number (0.16, 2.56, 0.16, 0.36, 1.96, 0.36, 0.16).
- He averages the squares and finds the variance: 0.8 (variance)
- The reporter finds the square root of the variance for City A: 0.89 (standard deviation).
- Next, the reporter subtracts City B’s mean from its temperatures (3.9, -5.1, 8.9, 4.9, -0.1, -4.1, -8.1)
- He squares them (15.21, 26.01, 79.21, 24.01, 0.01, 16.81, 65.61).
- The average of these squares is 32.41 (variance).
- The square root is 5.7 (standard deviation).
- City A’s standard deviation is 0.89 degrees, while City B’s standard deviation is 5.7 degrees. City A’s forecasts are more reliable than City B’s forecasts.
Now you see how standard deviation works. Even if you usually perform standard deviation equations on a calculator or spreadsheet formula, it’s good to see how the math works step by step.
Playing the Odds of Mathematics
Standard deviation is an important part of any statistical analysis. But it’s just one part of a wider study that includes probability exercises as well. Check out these examples of probability to further increase your mathematical understanding. You can also apply standard deviation to these random sampling exercises.